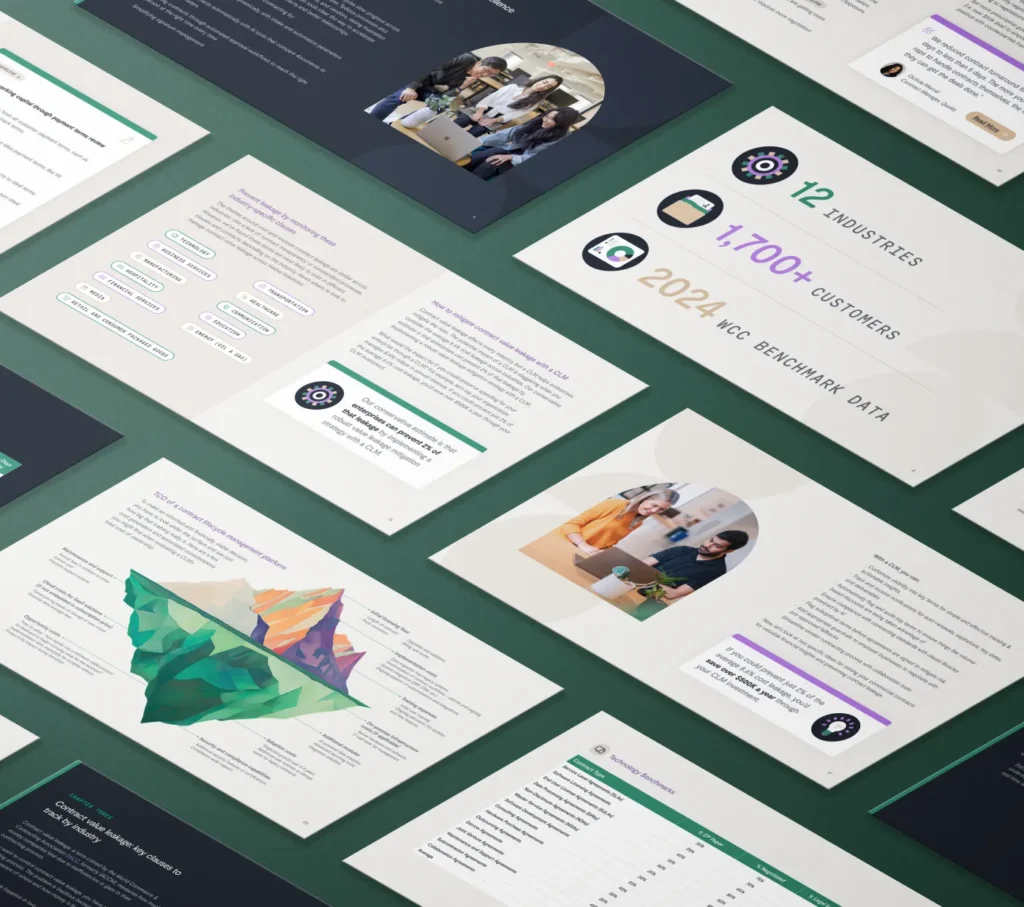
What We’ve Analyzed
12
Industries
1,700+
Ironclad customers
2024
WCC benchmark metrics
Drive org-wide impact
In this report, you’ll see where your organization stacks up and learn proven strategies for improving operations, mitigating risk, and surfacing opportunities for revenue recognition from your contracts.
Download the ReportPower dynamics are shifting in favor of business partners
Counterparty (CP) paper can result in a higher risk of unfavorable terms and longer cycle times. Learn strategies to successfully push your own paper, from working with sales to keeping your templates counterparty-friendly.
Valuable legal expertise is being spent on routine contract review
Legal teams provide the most value when using their expertise to work through complex legal scenarios. Get tips for reducing legal involvement in low-complexity contracts, from setting hard negotiation floors to educating business users.
Keeping an eye on cycle times is critical to improving operations
Measuring contracting speed from creation to signing lets you track performance over time and stop concerning trends before problems swell. We’ll walk you through exactly what you can do to improve efficiency.
Explore benchmarks by industry
Want a sneak peek at some of the data? Select your industry below.
Contract Type | % CP Paper | % Negotiated | % Legal Involvement | Average Days to Execute |
---|---|---|---|---|
Service Level Agreements (SLAs) | 30% | 75% | 80% | 30 |
Software Licensing Agreements | 25% | 70% | 85% | 35 |
End User License Agreements (EULAs) | 40% | 65% | 60% | 25 |
Contract Type | % CP Paper | % Negotiated | % Legal Involvement | Average Days to Execute |
---|---|---|---|---|
Master Services Agreements (MSA) | 80% | 70% | 90% | 45 |
Statement of Work (SOW) | 75% | 60% | 70% | 30 |
Service Level Agreements (SLAs) | 70% | 60% | 60% | 40 |
Contract Type | % CP Paper | % Negotiated | % Legal Involvement | Average Days to Execute |
---|---|---|---|---|
Supply Agreements | 30% | 80% | 75% | 45 |
Manufacturing Agreements | 25% | 85% | 80% | 60 |
Distribution Agreements | 20% | 70% | 70% | 50 |
Contract Type | % CP Paper | % Negotiated | % Legal Involvement | Average Days to Execute |
---|---|---|---|---|
Franchise Agreements | 60% | 85% | 95% | 90 |
Management Services Agreements (MSAs) | 55% | 80% | 90% | 70 |
Supplier Agreements | 65% | 70% | 80% | 50 |
Contract Type | % CP Paper | % Negotiated | % Legal Involvement | Average Days to Execute |
---|---|---|---|---|
Master Services Agreements (MSAs) | 70% | 75% | 90% | 45 |
Loan Agreements | 60% | 85% | 95% | 70 |
Credit Agreements | 65% | 80% | 90% | 60 |
Contract Type | % CP Paper | % Negotiated | % Legal Involvement | Average Days to Execute |
---|---|---|---|---|
Content Licensing Agreements | 70% | 75% | 90% | 50 |
Talent Agreements | 60% | 80% | 85% | 45 |
Production Services Agreements | 65% | 75% | 85% | 55 |
Contract Type | % CP Paper | % Negotiated | % Legal Involvement | Average Days to Execute |
---|---|---|---|---|
Supplier Agreements | 70% | 65% | 80% | 45 |
Distribution Agreements | 60% | 75% | 85% | 50 |
Retail Lease Agreements | 50% | 85% | 95% | 60 |
Contract Type | % CP Paper | % Negotiated | % Legal Involvement | Average Days to Execute |
---|---|---|---|---|
Carrier Agreements | 60% | 80% | 85% | 50 |
Logistics/Transportation Agreements | 65% | 75% | 80% | 45 |
Service Level Agreements (SLAs) | 70% | 65% | 75% | 40 |
Contract Type | % CP Paper | % Negotiated | % Legal Involvement | Average Days to Execute |
---|---|---|---|---|
Clinical Trial Agreements (CTAs) | 55% | 85% | 95% | 90 |
Master Services Agreements (MSAs) | 65% | 75% | 90% | 60 |
Research Collaboration Agreements | 50% | 85% | 95% | 80 |
Contract Type | % CP Paper | % Negotiated | % Legal Involvement | Average Days to Execute |
---|---|---|---|---|
Master Services Agreements (MSAs) | 65% | 70% | 85% | 50 |
Advertising/Media Buying Agreements | 60% | 65% | 75% | 40 |
Sponsorship Agreements | 60% | 70% | 80% | 35 |
Contract Type | % CP Paper | % Negotiated | % Legal Involvement | Average Days to Execute |
---|---|---|---|---|
Service Level Agreements (SLAs) | 70% | 60% | 75% | 40 |
Consulting Agreements | 65% | 65% | 80% | 35 |
Research Collaboration Agreements | 50% | 80% | 90% | 60 |
Contract Type | % CP Paper | % Negotiated | % Legal Involvement | Average Days to Execute |
---|---|---|---|---|
Power Purchase Agreements (PPAs) | 50% | 85% | 95% | 90 |
Energy Supply Agreements | 55% | 80% | 90% | 75 |
Service Level Agreements (SLAs) | 65% | 65% | 80% | 45 |
What's inside the report?
Introduction
Why contracting impact measurement matters
Part 1
Contracting value realization: KPIs for operational excellence
Part 2
Contracting benchmarks by industry & how to use them
Part 3
Contract value leakage: key clauses to track by industry
Part 4
Evaluating Total Cost of Ownership (TCO) & driving enterprise adoption
Part 5
How to structure your business value case & roadmap