


Unlocking Critical Business Value: Metrics for Sales-Side Commercial Contracting Teams

A colleague once remarked to Vincent Chuang, General Counsel at cybersecurity platform UpGuard, that “[general counsel] aren’t just lawyers anymore; they have to run a department.” And it’s a sentiment that he notes is a good reminder that being great in-house counsel is so much more than being great at knowing what the law is. It’s about planning, predicting, managing, budgeting, leading. And in that context, metrics are key. They give substance to what the legal team is actually doing, enabling them to engage with the broader organization as a true business department with impact on revenue. Chuang, whose prolific legal experience spans clerking for the 9th Circuit and leading several teams at Coursera as Associate General Counsel to co-founding a legal and government tech SaaS company, isn’t alone in this line of thinking. In fact, it’s been weaving through the in-house community over the past decade, reflected in the rise of the legal operations profession and the appearance of dedicated legal ops organizations like the Corporate Legal Operations Consortium, or CLOC.
Over the years, Chuang has created an extensive list of key metrics he relies on to surface the business value of the teams he runs and what insights they offer.
We recently sat down with him to chat through his approach to ones that are particularly useful for commercial contracting teams that support sales teams and which contract lifecycle management (CLM) tool he uses to do it. The metrics he discussed address the more operational aspects of running a contracting function, reveal opportunities to improve internal processes, ensure a sane work environment for teams, and provide context and justification for increasing team resources. Here’s what he had to say.
Form as Substance
I’ll start by noting that these metrics are primarily focused on revenue generating contracts–new, upsell, negotiated renewals, etc.–and not ancillary docs like non-disclosure agreements (NDAs) or amendments. There are metrics you can leverage for those, plus some blended metrics like “average legal response to all requests combined,” but we won’t discuss them here. We also focus here on metrics like workload and velocity of deals as opposed to substance of the deals themselves. For substance-related metrics, you’re tracking some qualitative aspect of the contract and how it might affect the business. Commonly referenced metrics there might include tracking “risk” based on the deviations of warranties, indemnities, and limitations on liability. Other items might include tracking financial terms like refunds and non-standard payment terms, and measurement of things like adherence to playbooks, deviated terms, and other systemic risks requiring mitigation.
With that in mind, let’s take a look. The metrics are:
Individual Metrics- Workflows Active Last 30 Days Per Person
- Workflows Assigned QTD Per Person
- Time Off Over Rolling 6-Month Period Per Person
- Ratio $ Negotiated ACV : $ Legal FTE
- Ratio $ Negotiated ACV : # Legal FTE
- Ratio # Sales FTE : # Legal FTE
- Ratio $ ARR (or Revenue) : # Legal FTE
- Ratio # Workflows : # Legal FTE
- Ratio $ Negotiated ACV : # Workflow
- Drafts Per Workflow
- Significant Drafts Per Workflow
- Median / Mean Days Between Drafts Per Workflow
- Time Between First and Last Negotiated Draft Per Workflow
- Time Attribution to Internal Legal, Internal Business, or Counterparty Per Workflow
- Number of Drafts versus ACV
- Time between First and Last Draft versus ACV
Natural Measurement Barriers
Before diving in, it’s important to note that there are a handful of not-insurmountable obstacles on the path to accurate measurement, including:
Systems. Actually getting the data and setting up the systems for measuring these metrics is surprisingly difficult. Things like deal size, headcount costs, and number of drafts per deal tend to live on separate systems owned by separate teams. And, in personal experience, pulling everything together ends up requiring a good amount of custom code and wrangling spreadsheets.
Standards. Good benchmarking doesn’t seem to exist, either. One reason may simply be the difficulty of actually getting the numbers. Another may be specific to the individual business. Things like average deal size, market segment, and buyer profile might all impact these metrics, which could make it difficult to compare across companies.
Incentives. Metrics get gamed. A few of the metrics here work together to disincentivize (or try to disincentivize) gaming. For instance, reducing the number of drafts that are generated per workflow might incentivize team members to hold onto drafts and not upload them into the workflow management system. The median days between drafts metric would hopefully counteract this by incentivizing the reduction of time between drafts.
Moreover, it is useful to identify floors and ceilings to these metrics, beyond which it may be unreasonable or un-useful to find additional improvement. At that point in the team lifecycle, it might be time to find different metrics. Ultimately, the goal here is to find ways to improve the system, not to micromanage.
As a side note, it is possible that some or none of these metrics work for you, your team, or your company. The hope is that taking a look at these inspires you to find something that works. Please share your favorite metrics with me so that I can learn, too.
Individual Metrics
- Workflows Active Last 30 Days Per Person
- Workflows Assigned QTD Per Person
- Time Off Over Rolling 6-Month Period Per Person
The goal of this set of metrics is to get an overall sense of work distribution among the team and permit for proactive allocation or reallocation of work. Why does this matter? First, it helps people be more effective managers, because they have clear visibility into what their teams are working on, how large their respective workloads are, and where they might need support. They can, for example, give credit where credit is due if a particular individual was swamped with work the last month. Or they can manage workloads across the teams, including across regions, and allocate (or reallocate) work for those leaving or returning from vacation.
Second, it gives people a better sense for how work flows over the course of a given time period, whether that’s a week, a month, a quarter, or a year. That, in turn, makes it easier to do things like giving team members the stretch projects they’re asking for during “slower periods” and then not penalize those same members when they don’t make progress on projects during the last X period of the quarter. Logistically, it also makes it easier to plan vacations and justify ALRS resources.
Third, it’s a very common phenomenon for lawyers, especially US-based lawyers, to take too little time off. With the inclusion of the “days off” metric, people can ensure that their team members are getting the breaks they deserve. If they don’t, the members will burn out. Burnout is bad for humans, and burned out humans are bad for teams.
A Matrix of Complexity
The metrics here don’t account for how complex each workflow is or even what constitutes a “workflow.” Different types of workflows may have varying complexities, and even the same type of workflow might have changing complexity depending on certain factors. For example, a “sales workflow” that is redlined on your paper is likely to be less work than a “sales workflow” where the buyer insisted on using their form master services agreement (MSA). And even when the workflow is premised on your own paper, some regions are more likely to negotiate than others. In a perfect world, it would be possible and easy to weigh the ‘workflow” value based on its complexity. It’s also important to note that there might be a better unit of measurement than “workflow” for your organization. Find whatever analog works best for you.
Effective Empathy
Additionally, a qualitative measure that can be used in connection with these quantitative measures is some version of the question “How are you doing?” or “How are you feeling?” or “How is your workload?” Answers to this question can give some context for what the quantitative measures actually mean. If people feel maxed out at X metric, then that might be the safe ceiling for that metric.
Individual Metrics Deep Dive
1. Workflows Active Last 30 Days Per Person
This metric measures the number of workflows that have seen activity within the past thirty days that are assigned to an individual and provides insight into workflow distribution across the team. I’ll also flag that not all workflows are active. Some workflows can be created and assigned but see no activity for a long period of time afterwards. What defines activity can be very broad, and I think that is generally appropriate, especially since context switching has a cost. A simple question could constitute activity for a workflow, as can a new set of redlines returned from the counterparty. And hopefully the overall activity type will even out over the entire set of active workflows so that it’s fairly comparable across the team.
The “Active workflows” metric is also likely a better indicator of actual current workload than the “Workflows assigned QTD per person,” as this one measures activity over assignment. And a workflow that’s been created and assigned to someone today will show up in both.
In theory, one would expect that as teams and processes get more efficient, each person’s ability to process more workflows increases, and thus this metric should trend higher over time. Nonetheless, there’s almost certainly a ceiling to this metric: by definition, the number of hours in a day is limited.
Moreover, it can be really hard to see a clean trend in the data, especially if you are at an early-stage, high-growth company in which deal volume is growing, head count is growing, and there isn’t a long history of steady state to compare to. In these situations, it’s very possible that the number will fluctuate if the window being observed is small enough. Still, there’s a lot of value in ensuring that work is being evenly distributed. And when combined with qualitative discussions, the metric can be used to identify points where new resourcing is required.
2. Workflows Assigned QTD Per Person
This metric measures the number of workflows assigned to each team member during the current quarter, providing insight into distribution of new work across the team. It’s a good way to ensure that as new tasks come in, they are being allocated thoughtfully.
If possible, it’s probably even better to change this metric to “workflows assigned last X days per person” so the counter doesn’t reset to zero at the beginning of each quarter. A rolling period will allow for even better visibility into how new work is being assigned, but that depends on the capabilities of your tools and reporting systems.
Whereas “workflows active last 30 days” measures current activity, this metric can be used to ensure that there’s a steady flow of work for people in the future. For example, someone without any recent assignments might quickly see a steep drop off in things to do in two or three months’ time. And for those just joining the team, this metric is a good way to make sure they’re ramping up with a sufficient pipeline of work.
3. Time Off Over Rolling 6-Month Period Per Person
The goal here is to ensure that people are taking enough time off for themselves. Certainly not everyone has to take the exact same amount off, and some might not even want to. Nonetheless, it’s a useful signal to kick off conversations.
Team Metrics
- Ratio $ Negotiated ACV : $ Legal FTE
- Ratio $ Negotiated ACV : # Legal FTE
- Ratio # Sales FTE : # Legal FTE
- Ratio $ ARR (or Revenue) : # Legal FTE
- Ratio # Workflows : # Legal FTE
- Ratio $ Negotiated ACV : # Workflow
In addition to making for effective executive planning, these metrics provide insight into the overall efficiency and cost-effectiveness of the contracting team relative to revenue generated. They can be useful to assess whether process changes are having an effect on efficiency or when projecting for future resource allocation: if the business is expected to grow by X, then the contracting function should grow by Y pursuant to these metrics. I tend to look at these on a quarterly basis and compare them quarter of quarter and year over year.
Definitions
Before jumping into the measurement of these metrics, I’ll first outline their definitions.
$ Negotiated ACV. This refers to actual cash value (ACV) that requires a legal touch, so ACV that is generated through a self-serve, click-through process would not be included here. Nor would ACV that closes through a process in which the buyer agrees to online terms without negotiating them. Similarly, a two year deal might count only the first year ACV into this number. Ultimately, the goal is to find a sensible way to capture the ACV that requires legal touch.
Legal FTE. This refers to full time employees (FTEs) that work on negotiated ACV. This is fairly straightforward when everyone in the function works on deals. Where it can get complicated is when the org gets large enough to start including managers or other team members who might support the contracting team but don’t necessarily work on deals themselves. At that point, there’s a question of who to include. One approach is to include managers when considering the “$ Legal FTE,” but not when considering “# Legal FTE” (or only including a partial FTE for the manager). The rationale here may be that when assessing the cost impact of the function, it is important to include every person’s costs, but when assessing deal efficiency and workload on a headcount basis, it only makes sense to include that portion of time actually allocated to deals.
Workflows. This metric should incorporate any workflows relating to negotiated ACV. It effectively maps to what work is done by the legal team to support the sales team. This could include workflows relating to redlines to template documents, customer MSAs, statements of work (SOWs), etc. This could also include deferred prosecution agreement (DPAs), referral agreements, request for proposal (RFP) reviews, and amendments. Depending on circumstances, this could also include sole source letters and termination letters. It really depends on how the legal and sales teams are structured. Find a definition that works for your org.
Team Metrics Deep Dive
1. Ratio $ Negotiated ACV: $ Legal FTE
This metric measures the relationship between the ACV of negotiated deals and the FTE costs of the team. At the end of the day, this is probably the only metric your CEO cares about. Drive this one up as high as possible. So many things impact this metric, and benchmarks are really hard to find. In practice, the mostly valuable thing for this metric is likely to just find opportunities to create a positive trend.
There are basically three buckets of things that impact this metric: deal context, deal efficiency, and team structure.
Deal Context
This refers to business circumstances that aren’t necessarily within the control of the legal team but affect the metric. For example, It’s frequently stated that a $20,000 deal that gets redlined is going to take about as much contracting effort as a $200,000 deal. And thus, simply increasing the average deal size should positively impact this metric. As another example, upsells will generally be lower effort. If upsells count into the negotiated ACV bucket, more upsells will improve this ratio. As a side note, though, buyers will not infrequently have deal size cutoffs under which a deal might not need any legal review (e.g. $20k). Once the relationship size increases above that threshold, however, significant legal review will be required. In those situations, upsells no longer improve the ratio. Other things like market segment, the champion’s leverage, product market fit, and region are all going to be out of the legal team’s control and still impact this ratio.
Deal Efficiency
This refers to trying to make the processing of each $ ACV more efficient, and it’s where contracting processes, cross functional processes, training, etc come into play. It’s also where the legal team has a lot more opportunity to influence outcomes or tie in objectives and key results (OKRs).
I’ve generally split this second bucket into two further subparts:
- The things that the legal team is responsible for doing that could be more efficient
- The things that the cross-functional teams input into the contracting process
The first category includes tasks like improving templates and talk tracks, drafting playbooks, and leveraging contract lifecycle management (CLM) systems and other legal tech. The strategy here is to constantly search for tasks that are repetitive in nature and find ways to streamline them.
The second category include tasks like signature processes, cross-functional deal approvals, account executive (AE) training, one-pagers, and lots and lots of enablement. In high-growth businesses, the sales team is changing constantly, so one should always find opportunities for cross-functional team members to get what they need–or be directed to resources that do so–without having to wait for someone on the legal team to respond.
Team Structure
This refers to mechanisms that influence legal FTE costs. It’s common for the first legal FTE to be a lawyer, or even the first few. You might also start with a commercial lawyer as the first hire in a new sales region. Over time, the contracting process should get more standardized. And many of the complexities should get ironed out or written down in a playbook. Following standardization, hiring should push towards more junior hires and non-attorney contract specialists. As the team and deal volume gets even larger, it should be possible to further specialize and pull categories of work into roles specifically hired for those tasks (e.g. administrative tasks all get centralized to a specific role). One can also consider hiring in lower cost regions, although time zones will be an eternal issue.
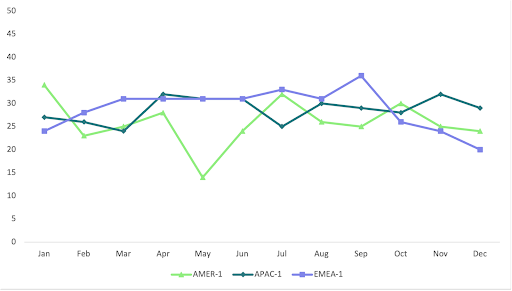
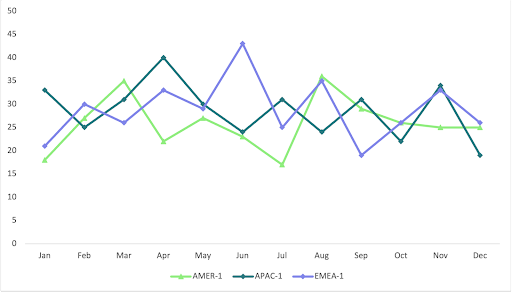
It can be interesting to take this metric and compare it across your business verticals. For example, you could look at it from a region by region basis, e.g. AMER versus EMEA versus APAC, or segment by segment, e.g. GOV versus mid-market versus SMB. Seeing the data in this way might help identify region or segment-specific issues that need addressing.
2. Ratio $ Negotiated ACV : # Legal FTE

This metric is similar in many ways to Ratio $ Negotiated ACV:$ Legal FTE, but it measures on a per person basis, making it a lot easier to draw a line from the individuals who work on deals every day to the outcomes they are driving. Because of the similarities, the strategies to improve this metric are going to be the same as for the $:$ ratio. For example, it’s useful to compare this metric across verticals and regions given that regional differences in deal sizes will have a big impact on this number.
There are only 24 hours in a given day, so there’s always going to be a theoretical maximum number of deals per person. As you grow and add people to the team who don’t necessarily work on deals, you might see this number take a hit. Nevertheless, the addition of team members would still presumably make the contracting process more efficient, so the ratio could still trend in a positive direction. One benchmark I’ve seen for this ratio is $10M new and upsell / expand business per FTE. This version equates “new and upsell / expand” business to “negotiated ACV”, which may not be exactly true for your business.
3. Ratio # Sales FTE : # Legal FTE
Getting all the data required for “Ratio $ Negotiated ACV : $ Legal FTE” and “$ Negotiated ACV : # Legal FTE” can take a lot of work and requires some amount of organizational maturity. Early on, it is likely to be easier and more feasible to count people, hence the “# Sales FTE : # Legal FTE” ratio. Even as the organization gets more mature, this metric is still useful to keep because it gives you a good pulse on how the org is changing and can serve as an early signal that more legal resourcing is required. Tracking it alongside the other metrics may also be useful to identify other issues.
As a side note, when counting # of “sales” some weighting might be appropriate. You might, for instance, count sales managers as 0 because they don’t directly contribute negotiated ACV, count each AE as 1, and count each CSM as 0.3 because renewals are often not negotiated or very lightly negotiated. It might also be possible to rough out the ratio of $ negotiated ACV to # legal FTE by looking at what the quotas are for each sales person. One target ratio I’ve seen is 10:1. Just like the $ Negotiated ACV ratios, however, this is heavily influenced by the circumstances of your business. Interestingly (to me as a non-sales expert), a fairly standard AE quota is around $1M (standard, I think because of OTE targets and common ACV sizes), and this roughly matches to the $10M new and upsell / expand business per Legal FTE ratio above.
4. Ratio $ Annual Recurring Revenue (ARR) or Revenue : # Legal FTE
This metric measures the relationship between all revenue, not just negotiated, against the number of FTE. A ratio can also be made against the cost of the FTE instead of the number. It also covers more than just the negotiated ACV metrics, as ARR includes all non-negotiated revenue as well. Optimizing this metric might present an opportunity to look for efficiencies that might not be directly associated with closing each deal.
One benchmark I’ve heard is $35M ARR per FTE. To be honest, though I have not experienced this benchmark myself, I think the benchmark might be missing some nuance that the negotiated ACV metric tries to capture. Namely, the negotiated ACV metric tries to account for work that actually needs to be done and the ARR doesn’t. If you know differently, please let me know. In theory, for example, a company could have $35M in ARR forever and need very little legal input.
ARR Pathways
The standard “triple, triple, double, double, double” pathway means that a company gets to $2M of ARR and then, on a year-over-year basis, grows from $2M => $6M, $6M => $18M, $18 => $36M, $36M => $72M, and $72M => $144M. The jump from $6M to $18M can be accomplished with just one contracting resource. The number of ramped AEs it takes to hit this triple also seems to generally match the number target ratio of 10:1.
The doubling from $18M to $36M seems like a real stretch to get done with just one contracting resource. The end of quarter rush would be extremely miserable for that person, not to mention the volume of work would make taking vacation extremely difficult. It may be possible that this “one” FTE is actually divided between two people, in which case it may be that they’re both focused on contracts during contracting-heavy seasons and thus able to output the work of more than one FTE during those periods and then less than one FTE on contracting during the early parts of a quarter. This would not be a bad way to structure the team.
The amount of cross-sells and expansions likely also impacts this. If it is the case that cross-sells / expansions are a big contributor to the overall ARR, and those types of deals generally take less legal input, it could be possible that the $35M ARR per FTE ratio works. But at that point, it works because the pool of negotiated ACV (and adjacent work) is sufficiently small that it can be handled by one FTE. If anything, it may be possible that the $35M ARR per FTE ratio is more an indicator that if one FTE can’t handle $35M of ARR, the company might have a net run rate (NRR) issue. Alternatively, it might mean that if one FTE can’t handle $35M of ARR, the company might need to negotiate fewer deals and force a “take it or leave it” situation to buyers.
For a company that is following the “triple, triple, double, double, double” year-over-year pathway and with most deals around $25-50k ACV, I think the metric works up to and including the second triple. After that, I’m just not sure how it would work unless deal sizes increased dramatically or the business had really strong NRR numbers and the expansions just didn’t need that much legal work.
5. Ratio # Workflows : Legal FTE
This metric tracks workload per person and assumes that the definition of workflow does not change too significantly (e.g. not combining multiple workflows into one or splitting a workflow into multiple). Otherwise, it will be difficult to compare over time.
Since it’s not yet clear to me which direction this metric should track over time, I tend to use it as a signal so that I can figure out what has changed. On the one hand, getting more efficient over time would imply that each person should be able to cover more workflows over time (subject to a peak). On the other hand, if this ratio has increased, but not much else has changed, it’s a good opportunity to figure out why. Perhaps there’s a sudden increase in deal amendments that need to be reviewed or termination letters that need to be sent.
6. Ratio $ Negotiated ACV : # Workflow
This metric gives you visibility into the relationship between $ and legal work volume. In theory, one would want this ratio to get higher over time, as that would represent higher dollar values per unit work. It’s possible that $ : # of drafts might work as well. It really depends on how work is best measured for you. Again, find what works best for you.
It’s not clear how the legal team can impact this ratio, so it’s likely most useful as a signal to be used for other things, like to see whether deal sizes are changing. If the deal sizes are dropping, it’s likely going to take more work to support the same total amount of negotiated ACV, and it’s going to impact the relevant staffing ratios.
There can sometimes be a disconnect between what the sales team considers a “deal” and what the legal team considers a “deal.” Depending on how your sales team sets up opportunities, there might be multiple opportunities that all wrap up into one piece of legal paper. For example, one “deal” that tries to consolidate a purchase made by two separate business units at one company might be treated for internal tracking purposes as multiple separate opportunities with various renewal, upsell, and expansion components.
Deal Metrics
- Drafts Per Workflow
- Significant Drafts Per Workflow
- Median / Mean Days Between Drafts Per Workflow
- Time Between First and Last Negotiated Draft Per Workflow
- Time Attribution to Internal Legal, Internal Business, or Counterparty Per Workflow
- Number of Drafts versus ACV
- Time between First and Last Draft versus ACV
These metrics focus on opportunities for the legal team to influence the deal process. For instance, it may not seem immediately important, from a legal team’s perspective, to consider the time it takes to go from workflow launch to a signed deal. However, since the signature process is heavily influenced by sales teams and counterparties, it may actually be that the legal team has completed the final version of the document, but signature will take another two weeks because of a process issue on the counterparty side. In this situation, legal leadership can be more effective by proactively addressing the process issues they can identify by looking at the metrics.
Deal Metrics Deep Dive
1 . Drafts Per Workflow
How many drafts does it take to get to a signable version of the agreement? The theoretical minimum is one draft, e.g., the buyer signs the first draft provided by the seller. In practice, this is effectively impossible, because if there’s a possibility that the buyer is going to accept the first draft as is, it’s probably best to just have a click through or online terms and never have it show up as negotiated ACV. As far as performance goes, this number should generally trend down over time. Although, as noted above, the floor is likely going to be some number above 1. This metric is also an opportunity to ask the question “What is it exactly that we’re generating new versions for?”
Draft Minimization Strategies
To the extent that your workflows include commercial-related language, e.g. SKU-specific language and payment terms, an easy way to drive this number down is to ensure that the first draft is a commercially-accurate reflection of what the buyer is expecting. For example, if the buyer has already agreed to net 45 terms, and a quote has been approved for net 45 terms, the document should go out with net 45 terms.
It might also be worth restructuring your documents so that things that are more commercially oriented, like payment terms, are kept in an entirely separate document. Although once these get negotiated, they might end up in front of the legal team anyway.
Another way to minimize drafts is to provide extensive reasoning around proposed changes. It is very difficult to respond to redlines when there isn’t reasoning and so a common response to a set of changes that doesn’t include any reasoning is to decline the changes with a request that the other side explain. This effectively delays the entire process by at least one exchange of drafts. Make it part of team culture that all changes include a reason. A byproduct of this is that every good playbook should include not just acceptable contract language but an associated talk or comment track.
2. Significant Drafts Per Workflow
Not all changes to a document require the same amount of work. There are certain redlines that can be made in a ministerial fashion, and the main cost is the fixed cost of having to work on the draft at all. These types of changes include things like changes to the choice of law or changes, modifying the effective date, fixing a net payment date, etc. On the other hand, certain types of drafts require significantly more work, either due to the type of changes or volume of changes. These might include responding to line edits on a liability section and providing an explanatory note, fixing complex formatting, or responding to multiple pages of redlines. This metric measures the number of drafts in a workflow that are of the latter, “more work” type.
It can be difficult to determine what constitutes “more work” or not. Roughly is probably good enough. One way of categorizing is by whether the version was generated by downloading and editing locally in a word processor (or in Google docs) or whether the version was generated by updating a form or edited in a CLM’s online editor. The distinction here is that this metric is a proxy for “effort” and “difficulty,” and changes that are in a word processor are likely those that require the features of a word processor. If not, editing in a more convenient, less robust online editor might evince a simpler set of changes and thus not a “more work” draft. To be honest, the main reason I went with this categorization method was that it was something my CLM was able to track. Even then, roughly was indeed good enough. I hope you find a better way.
Looking at the entire pool of workflows, the percentage of workflows that contain a “significant draft” should trend down over time and settle at some percentage, even if the number of drafts in a workflow doesn’t change. In practice, this means finding ways to increase the types of drafts that can be created using as much automation or clicking as possible. Things that are commonly negotiated should be copy and pasteable or insertable into a draft via clicking buttons in an interface instead of requiring manual entry. Hopefully most deals can close without needing any significant drafts.
3. Median or Mean Days Between Drafts Per Workflow
How much time did it take between the generation of each draft of a document? In some situations (namely if you only generate one draft internally for each turn), this is effectively a turn tracker that tracks how long it takes each party to return a draft.
There are at least a few items that make this metric messy. For internal turns, multiple versions may be generated quickly. And so the amount of time between these drafts might be fairly low, e.g. on the order of hours. For counterparty turns, you have no control over how long the counterparty will take before returning their draft. And so the time between an internal draft and an external draft in response might be on the order of days.
Having said that, I still like this metric because it does provide some sense of turnaround time. And it does give something to measure against in the hopes of reducing overall time between drafts. To the extent that this metric can be gamed by increasing the number of internal drafts and reducing the time between those drafts, that can hopefully be counteracted by making sure the Drafts Per Workflow metric is trending downwards.
4. Time Between First and Last Negotiated Draft Per Workflow
This metric measures how much time it takes to get from the first draft of the legal doc (usually equivalent to when sales requests for an editable MSA) to the last version of the doc (which is the signable document). As noted above, this is not the same as between when the initial sales request is made (which is approximately when the first version is generated) and when the deal is signed.
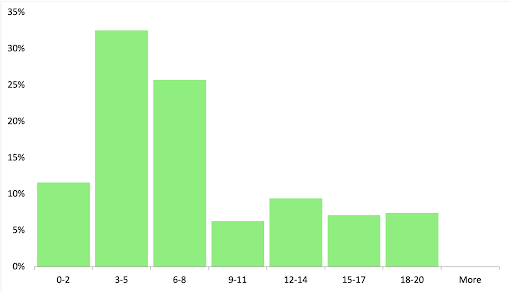
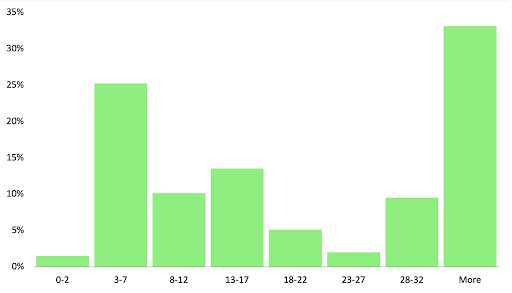
Breaking Down the Buckets
I’ve found this one is mostly useful to separate deals into different time buckets. There end up being approximately four buckets: a) effectively zero time; b) 5-7 calendar days; c) 10-15 calendar days; d) 30+ days. Buckets “a” and “b” may be combined.
The narrative looks something like this. There are some deals where there are effectively no redlines or redlines that can be exchanged and completed just on the papers without a call. For this bucket of deals, there are likely some changes around choice of law, some questions around automatic renewal of the deal, maybe some marketing terms, etc. These deals often reach the final signable draft within 5-7 days.
Then there are the deals that require much more extensive changes. There might be disagreements over the boiler plate and liability shifting sections, or someone might need additional clarification around the DPA or insurance provisions. A call might be needed in order to explain some of the particulars of your product to a procurement team or legal team. As long as the buy side is engaged (i.e. fairly quick turnarounds and easy to schedule calls), these can get done fairly quickly.
Finally, there are the deals where things just take a long time. Very often these include deals that occur on customer paper that are simply not built for purpose. And often include negotiations on provisions like data privacy where it can take a lot of internal escalations on both sides in order to get something done.
Once you get a sense of how these deals bucket out (the days provided above might not match your particular business), it can be useful to use the data to help manage expectations. You can communicate with the sales team about the likelihood a given deal will finish within a period of time, e.g. “Deals that look like this usually take this long to finish . . . .”
Time Optimization
It can be hard to optimize this metric over the total blended median. Instead, I like to think about how we can get deals to move between the buckets. It might be possible to move a certain category of deals from bucket “c” to bucket “b” by providing your sales teams with agreed upon positions that are also best and final positions. It might be possible to narrow the time window for bucket “b” deals by looking for commonly-negotiated provisions that maybe aren’t that risky or valuable to your business and just removing those terms altogether.
It might be possible to shift “d” deals to “c” by insisting on using your paper. Although I think that realistically things that are in the “d” bucket are likely to always be in the “d” bucket. They are there because the counterparty can be inflexible and there are always going to be counterparties that are like that.
5. Time Attribution to Internal Legal, Internal Business, or Counterparty Per Workflow
This metric tries to determine “who contributes what time to the legal process.” It is related to–and possibly simply a more detailed view of–the “Time Between First and Last Negotiated Draft Per Workflow” metric. Being harder to set up and get data for, I wouldn’t worry about it until setting up the prior metric first. As far as measurement is concerned, the metric takes the total time to get from the first draft to the last, signable draft, and attributes portions of that time to who the deal was waiting on.
There are a few ways that the metric can be further broken down. First, you can divide it into “internal” versus “counterparty” buckets. You have little control over the counterparty bucket; thus, much of the benefit and optimization is trying to figure out how much time of a total deal time is spent by your internal team. If your CLM has a “turn tracker,” the data for this metric should be fairly easy to approximate.
As your process gets more sophisticated, I find it valuable to try and further parse out who on the internal side is contributing what amount of time to the process. There are portions of the internal turn time that depend solely on legal, but there are also portions of the internal time that are often tied to cross-functional approvals and reviews, e.g. business approvals for new commercials, security review on contractual language, insurance review, etc.
It is possible that the best next optimization is not necessarily on things that legal has control over, but figuring out how to reduce time for parts of the “legal step” that are contributed by other internal teams. For instance, it may be that there is time lost in the interface step (e.g. X needs to tag Y for review), in which case one might look into ticketing. Or it might be that better playbooks might avoid a need to tag in internal teams altogether.
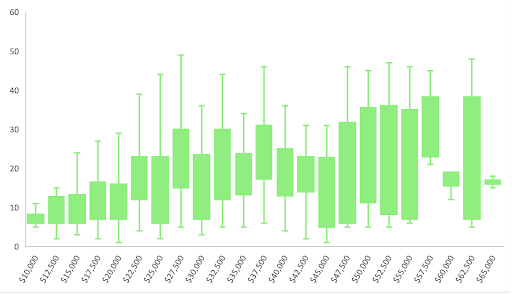
6. Number of Drafts versus ACV

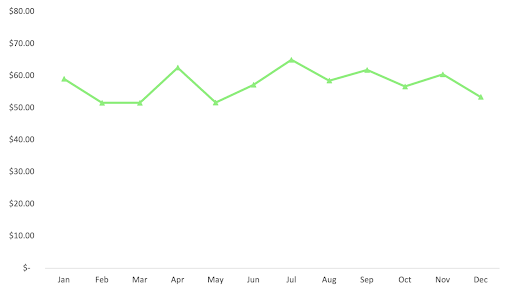
I use this metric to see if there is any relationship between the number of drafts a deal requires and the ACV of the deal. A scatter plot or box-and-whisker is a useful visualization.
I’m not sure what the relationship is supposed to be, and how it should change with increasing ACV. Intuitively, lower ACV deals should require fewer drafts than higher ACV deals. But it wouldn’t be surprising if $30k deals take approximately as many drafts as $60k deals. It also wouldn’t be surprising if $150k deals took approximately as many drafts as $300k deals. Where it would be helpful would be to see whether the $30k deals were often taking as many drafts as the $300k deals or if there was no relationship whatsoever between deal size and draft count. In those situations, it would be helpful to figure out why and perhaps instate rules and processes to drive down the amount of work for lower value deals. One possibility is to say “No negotiating for deals less than <$X.” It might also be relevant to track “Significant Drafts” against ACV. Much of the same reasoning applies.
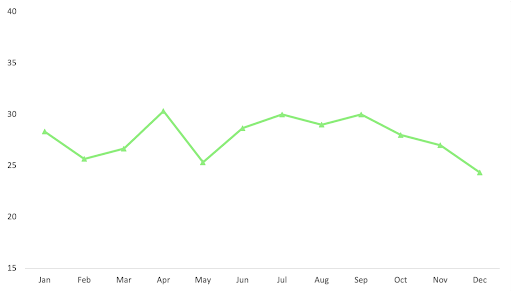
7. Time between First and Last Draft versus ACV
This is similar to the Number of Drafts versus ACV metric, and tracks the same way intuitively. Lower ACV deals should take less time than higher ACV deals because ideally, they should not trigger as much scrutiny from procurement teams or require fewer internal approvers. They can even sometimes fit under the threshold for legal review altogether. On the other end, high value deals might have more stakeholders that need to collectively agree.
There might be less opportunity to optimize this metric as compared to the Number of Drafts versus ACV metric. Where the Drafts metric maps to the complexity in papering the deal, this Time metric maps, perhaps, to the complexity for everything that relates to closing the deal. For the items that are in the counterparty’s control, e.g. internal approvals, it is likely that you have little control over those anyway.
Adjacent Metrics
Though we won’t get into details here, there are many adjacent metrics that might be helpful to take a look at. Ultimately any metric can be valuable as long it can give you insight into your operations. Metrics you might consider could include:
Though we won’t get into details here, there are many adjacent metrics that might be helpful to take a look at. Ultimately any metric can be valuable as long it can give you insight into your operations. Metrics you might consider could include:
- Ratio of non-negotiated $ ACV to negotiated $ ACV
- Average time for legal to respond to each type of request
- Average time for legal to respond to a request blended over all requests
- Ratio of our paper : our paper w/ minimal redlines : our paper w/ significant redlines : customer paper
- How often 2nd, 3rd, etc options are used and for what clauses
- Frequency of non-standard indemnities, LoL, insurance provisions as a measure of risk
- How many NDAs are negotiated versus not negotiated
The Role of a CLM in Measurement
I first learned about Ironclad in 2015 when CEO Jason Boehmig launched an early version of it on technology forum Hacker News. Even as someone who considered themselves techforward and a self-proclaimed “early adopter,” it was hard to appreciate how big of an impact something like Ironclad could have.
Modern CLMs like Ironclad are a significant leap from the legacy, single-user document management systems I used more than a decade ago. In those systems, I could certainly keep track of document versions and run redlines. And I could even grant colleagues the ability to find and access my documents. But there was always an inherent assumption to those systems that documents were used and owned by one person.
Philosophically, Ironclad understands that the contract lifecycle, especially in-house, is a heavily cross-functional, multi-stakeholder effort. By effectuating that philosophy with software that centralizes all the various stakeholder interactions into one place, the foundation for measuring the contract lifecycle suddenly becomes possible in a way that didn’t exist before.
In early 2020, I experienced having to implement Ironclad for the first time. The benefits were immediate. Templates were now versioned and tracked in one place. We stopped using a spreadsheet to track deals and assignees. As the team expanded, we implemented automatic assignment to legal team members. As we expanded more, we were able to automate regional and vertical assignments. We could see deal history without having to piece together a story from multiple email chains. And ultimately, long before we even thought about complex metrics and pretty graphs, all of these things became easily accessible data points about the contracting lifecycle that we could use when conversing with the business.
So much of the barrier to data visibility is data acquisition. When using a spreadsheet to track contracting, information about when someone generates a new draft, who is assigned a deal, when that deal finishes, etc. all has to be manually entered. But with Ironclad, that data is generated and acquired as an inherent part of using the platform. Each new workflow comes with a start date and an assignee. Each new draft is dated and the version number is incremented. This isn’t usually the sort of automation people think of when thinking about “automating” the contracting lifecycle. But from an operations perspective, this automated layer of metadata is foundational.
Having said that, every business is also slightly different. What needs to be tracked and measured is different too. Being able to build out a metadata layer that could be manually populated and updated as the deal progressed to close meant that we could track the things we thought were important to track. On the metrics front, Ironclad allowed us to add in some cross-functional data like deal sizes without having to rely on integrations. I expect that the manual acquisition of contract details will diminish over time as AI tooling improves.
As we got more sophisticated, the fact that Ironclad was a web-based platform with an API meant that we could leverage software to combine these pieces of contract data with other data from across the company. We could pull contract data and combine it with finance and HR data out of other systems, and we could give factual, data-driven justifications for forward looking headcount planning. And we could combine contract data with sales data in order to find patterns in the deals we were working on so that we could dig deeper to find possible efficiencies in the process.
I’m biased, but a highly effective legal team is a key part of a successful go-to-market motion. And part of becoming highly effective is looking at the relevant data to make informed decisions. With modern CLMs like Ironclad, a treasure trove of contracting data has been made accessible and usable. Now, nearly a decade after I first learned about Ironclad, we are still in the very early days of fully leveraging all the contracting information we have at our fingertips. And as technology and time progresses, I expect that this will extend to all the other parts of the in-house legal function as well. I look forward to it.
The views expressed here belong to the author and may not reflect those of the author’s current or prior employers. All data presented here are sample data generated for the purposes of this article. You can reach Vincent at vince@elmmetrics.com, via LinkedIn, or find more information about metrics for in-house legal teams at www.elmmetrics.com.
Ironclad is not a law firm, and this post does not constitute or contain legal advice. To evaluate the accuracy, sufficiency, or reliability of the ideas and guidance reflected here, or the applicability of these materials to your business, you should consult with a licensed attorney. Use of and access to any of the resources contained within Ironclad’s site do not create an attorney-client relationship between the user and Ironclad.


